
Page 282 - 2025 Los Angeles Angels Media Guide
P. 282
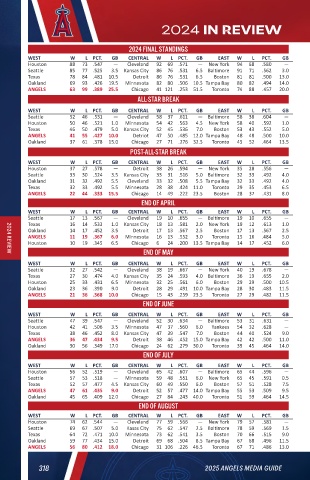
2024 IN REVIEW


                                  2024 FINAL STANDINGS
        WEST       W   L  PCT.   GB   CENTRAL   W   L  PCT.   GB   EAST   W   L   PCT.   GB
        Houston    88   73  .547   —   Cleveland   92  69  .571   —  New York   94  68   .580   —
        Seattle    85   77  .525   3.5  Kansas City   86  76  .531   6.5  Baltimore   91   71   .562   3.0
        Texas      78   84  .481  10.5   Detroit   86  76  .531   6.5   Boston   81   81   .500   13.0
        Oakland    69   93  .426  19.5   Minnesota   82  80  .506  10.5  Tampa Bay   80  82   .494   14.0
        ANGELS     63   99  .389  25.5   Chicago   41  121  .253  51.5   Toronto   74   88   .457   20.0
                                    ALL-STAR BREAK
        WEST       W   L  PCT.   GB   CENTRAL   W   L  PCT.   GB   EAST   W   L   PCT.   GB
        Seattle    52   46  .531   —   Cleveland   58  37  .611   —  Baltimore   58  38   .604   —
        Houston    50   46  .521   1.0   Minnesota   54  42  .563   4.5  New York   58  40   .592   1.0
        Texas      46   50  .479   5.0  Kansas City   52  45  .536   7.0   Boston   53  43   .552   5.0
        ANGELS     41   55  .427  10.0   Detriot   47  50  .485  12.0  Tampa Bay   48  48   .500   10.0
        Oakland    37   61  .378  15.0   Chicago   27  71  .276  32.5   Toronto   45  52   .464   13.5
                                  POST-ALL-STAR BREAK
        WEST       W   L  PCT.   GB   CENTRAL   W   L  PCT.   GB   EAST   W   L   PCT.   GB
        Houston    37   27  .578   —   Detroit   38  26  .594   —  New York   35  28   .556   —
        Seattle    33   30  .524   3.5  Kansas City   33  31  .516   5.0  Baltimore   32  33   .492   4.0
        Oakland    31   32  .492   5.5   Cleveland   33  32  .508   5.5  Tampa Bay   32  33   .492   4.0
        Texas      32   33  .492   5.5   Minnesota   28  38  .424  11.0   Toronto   29  35   .453   6.5
        ANGELS     22   44  .333  15.5   Chicago   14  49  .222  23.5   Boston   28  37   .431   8.0
                                     END OF APRIL
        WEST       W   L  PCT.   GB   CENTRAL   W   L  PCT.   GB   EAST   W   L   PCT.   GB
        Seattle    17   13  .567   —   Cleveland   19  10  .655   —  Baltimore   19  10   .655   —
        Texas      16   14  .533   1.0  Kansas City   18  13  .581   2.0  New York   19  12   .613   1.0
        Oakland    14   17  .452   3.5   Detroit   17  13  .567   2.5   Boston   17   13   .567   2.5
        ANGELS     11   19  .367   6.0   Minnesota   16  13  .552   3.0   Toronto   15  16   .484   5.0
        Houston    10   19  .345   6.5   Chicago   6   24  .200  13.5  Tampa Bay   14   17   .452   6.0
                                      END OF MAY
   2024 REVIEW
        WEST       W   L  PCT.   GB   CENTRAL   W   L  PCT.   GB   EAST   W   L   PCT.   GB
        Seattle    32   27  .542   —   Cleveland   38  19  .667   —  New York   40  19   .678   —
        Texas      27   30  .474   4.0  Kansas City   35  24  .593   4.0  Baltimore   36  19   .655   2.0
        Houston    25   33  .431   6.5   Minnesota   32  25  .561   6.0   Boston   29  29   .500   10.5
        Oakland    23   36  .390   9.0   Detroit   28  29  .491  10.0  Tampa Bay   28  30   .483   11.5
        ANGELS     21   36  .368  10.0   Chicago   15  43  .259  23.5   Toronto   27  29   .482   11.5
                                      END OF JUNE
        WEST       W   L  PCT.   GB   CENTRAL   W   L  PCT.   GB   EAST   W   L   PCT.   GB
        Seattle    47   39  .547   —   Cleveland   52  30  .634   —  Baltimore   53   31   .631   —
        Houston    42   41  .506   3.5   Minnesota   47  37  .560   6.0   Yankees   54  32   .628   —
        Texas      38   46  .452   8.0  Kansas City   47  39  .547   7.0   Boston   44  40   .524   9.0
        ANGELS     36   47  .434   9.5   Detroit   38  46  .452  15.0  Tampa Bay   42   42   .500   11.0
        Oakland    30   56  .349   17.0   Chicago   24  62  .279  30.0   Toronto   39  45   .464   14.0
                                      END OF JULY
        WEST       W   L  PCT.   GB   CENTRAL   W   L  PCT.   GB   EAST   W   L   PCT.   GB
        Houston    56   52  .519   —   Cleveland   65  42  .607   —  Baltimore   65  44   .596   —
        Seattle    57   53  .518   —   Minnesota   59  48  .551   6.0  New York   65  45   .591   0.5
        Texas      52   57  .477   4.5  Kansas City   60  49  .550   6.0   Boston   57   51   .528   7.5
        ANGELS     47   61  .435   9.0   Detroit   52  57  .477  14.0  Tampa Bay   55  53   .509   9.5
        Oakland    45   65  .409  12.0   Chicago   27  84  .243  40.0   Toronto   51   59   .464   14.5
                                    END OF AUGUST
        WEST       W   L  PCT.   GB   CENTRAL   W   L  PCT.   GB   EAST   W   L   PCT.   GB
        Houston    74   62  .544   —   Cleveland   77  59  .566   —  New York   79  57   .581   —
        Seattle    69   67  .507   5.0   Kasas City   75  62  .547   2.5  Baltimore   78  59   .569   1.5
        Texas      64   72  .471  10.0   Minnesota   73  62  .541   3.5   Boston   70  66   .515   9.0
        Oakland    59   77  .434  15.0   Detroit   69  68  .504   8.5  Tampa Bay   67  68   .496   11.5
        ANGELS     56   80  .412  18.0   Chicago   31  106  .226  46.5   Toronto   67  71   .486   13.0

           318                                       2025 ANGELS MEDIA GUIDE